|
|
|
|
|
 |
|
|
|
|
|
|
|
|
|
|
TRMM wins the 2016 Group Pecora Award (http://remotesensing.usgs.gov/descriptionaward.php) .
The William T. Pecora Award is presented annually to individuals or groups that make outstanding contributions toward understanding the Earth by means of remote sensing. The award is sponsored jointly by the Department of the Interior (DOI) and the National Aeronautics and Space Administration (NASA).
The award was established in 1974 to honor the memory of Dr. William T. Pecora, former Director of the U.S. Geological Survey and Under Secretary, Department of the Interior. Dr. Pecora was a motivating force behind the establishment of a program for civil remote sensing of the Earth from space. His early vision and support helped establish what we know today as the Landsat satellite program.
The text of the nomination letter can be found here.
The Tropical Rainfall Measuring Mission (TRMM) is a joint mission between NASA and the Japan Aerospace Exploration (JAXA) Agency to study rainfall for weather and climate research. The TRMM satellite ended collecting data on April 15, 2015 (see http://pmm.nasa.gov/trmm/mission-end ). Launched in late November 1997, with a design lifetime of 3 years, the TRMM satellite produced over 17 years of valuable scientific data. TRMM carried 5 instruments: a 3-sensor rainfall suite (PR, TMI, VIRS) and 2 related instruments (LIS and CERES). TRMM delivered a unique 17-year dataset of global tropical rainfall and lightning. The TRMM dataset became the space standard for measuring precipitation, and led to research that improved our understanding of tropical cyclone structure and evolution, convective system properties, lightning-storm relationships, climate and weather modeling, and human impacts on rainfall. The data also supported operational applications such as flood and drought monitoring and weather forecasting.
TRMM Reentry Assessment (pdf file)
(6/3/2015) Frequently Asked Questions about TRMM Spacecraft Re-Entry .
|

Friday January 13, 2017
Deadly Torrential Rain Hits Southern Thailand
Widespread flooding has recently caused the deaths of dozens of people in southern Thailand. Frequent and persistent downpours have resulted in record rainfall totals.

NASA's Integrated Multi-satellitE Retrievals for GPM (IMERG) were used to estimate the total amount of rain that fell over southern Thailand during the past week. Extreme rainfall totals of over 700 mm (27.6 inches) were shown over the Gulf of Thailand. The highest rainfall total estimates over land were greater than 500 mm (19.7 inches) on the eastern coast of the Malay Peninsula in the Bang Saphan district.

Rainfall has greatly increased over Thailand during this La Nina year.
Very low rainfall totals occurred over Thailand during last year's El Nino event. The
rainfall anomaly analysis shown above was made by comparing TRMM calibrated rainfall climatology to "near real-time" Multi-satellite Precipitation Analysis (TMPA-RT 3B42RT) data collected over a thirty day period. The panel on the left shows rainfall departure from normal during the 2016 El Nino event. The second panel shows the extreme increase in normal rainfall over southern Thailand during the current La Nina event. The TRMM satellite produced over 17 years of precipitation measurements that were a valuable contribution to global rainfall climatology.

Click here to see a
1280x720 (Quicktime) rainfall accumulation animation.
Click here to see a
1280x720 (MPEG) rainfall accumulation animation.
TRMM was a joint mission between NASA and the Japanese space agency JAXA.
Images and captions produced by Hal Pierce (SSAI/NASA GSFC).
IMERG rainfall totals have been adjusted to reflect observed values in other similar extreme rainfall events.
|
Thursday January 12, 2017
PINEAPPLE EXPRESS DELIVERS HEAVY RAINS, FLOODING, DROUGHT RELIEF TO CALIFORNIA
California, which has long been suffering through a strong, multi-year drought, is finally
beginning to see some much needed relief as a result of a recent series of storms that are part of a weather pattern known as the “Pineapple Express.” The Pineapple Express is known as an atmospheric river. A large,
slow-moving low pressure center off of the West Coast taps into tropical
moisture originating from as far south as the Hawaiian Islands. This moisture is then channeled
northeast by the subtropical jet steam towards the West Coast where the
topography aids in squeezing out the moisture as air flows over the mountain
ranges. Though these rains are certainly welcome and very much needed, they have also led to flooding and
mudslides. The first storm in the series arrived in the middle of last week and brought rain to northern and central California. The next storm occurred over the weekend and brought heavy rains again to mostly northern and central California although southern California also received significant amounts. This event lead to widespread flooding, down trees and mudslides, especially in the Sierra Nevada where hurricane force winds occurred and Interstate 80 was closed due to a massive mudslide. Blizzard, winter storm, high wind, and flood warnings are already in effect as the third plume of moisture in this series is already making its way through the interior part of the state where several feet of snow are expected in the Sierra Nevada.
The Tropical Rainfall Measuring Mission satellite (known as TRMM) was launched
into service back in November of 1997. It was designed to measure rainfall over
the global Tropics using both passive and active sensors, including the first
and at the time only precipitation radar in space. With its combination of passive microwave and active radar sensors, TRMM was used to calibrate rainfall estimates from other satellites to expand its
coverage. The TRMM-based, near-real time Multi-satellite Precipitation Analysis
(TMPA) at the NASA Goddard Space Flight Center has been used to monitor rainfall
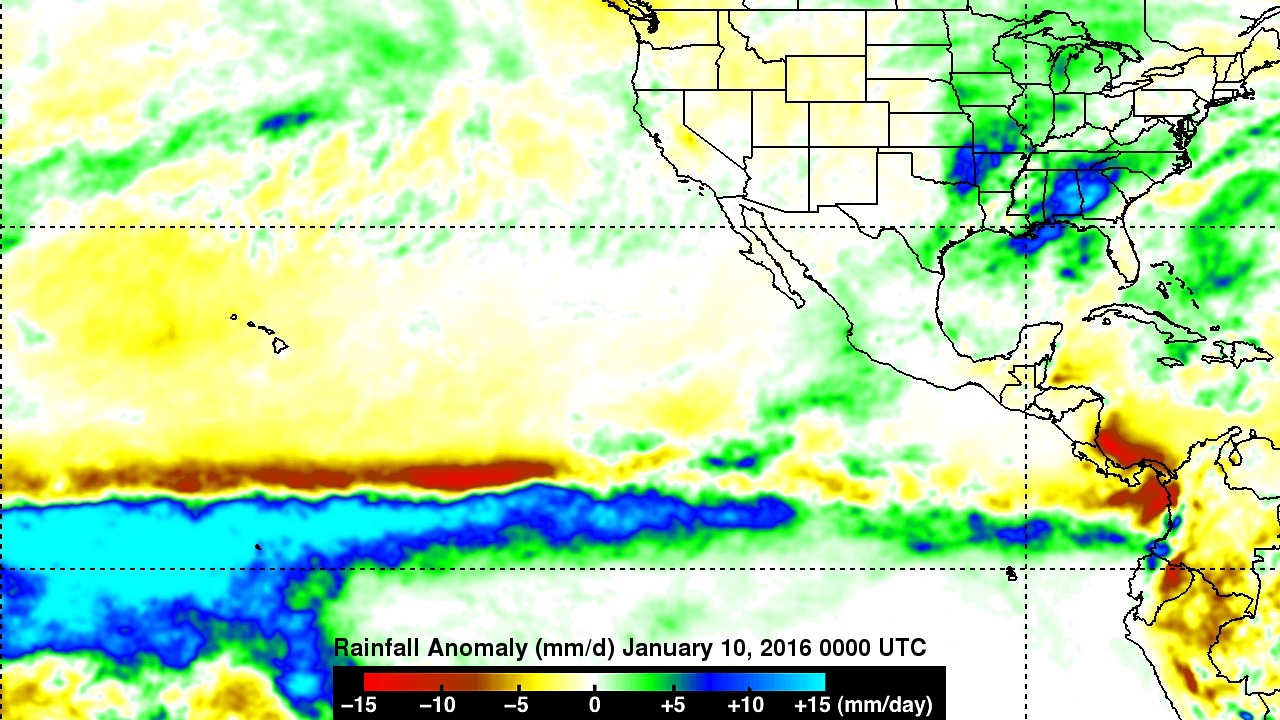
over the global Tropics for many years. By subtracting the long-term average rainfall or climatology, rainfall anomalies can be constructed to show deviations from the normal pattern.

The first image shows rainfall anomalies for the one month period ending on 10 January 2017.
During this period, higher-than-average precipitation extends from over and east of the Hawaiian Islands northeastward all the way into California and covers most of the state, eastern Oregon and much of the northern Rockies (green areas). Embedded within this region are areas of much higher than average rainfall (blue areas) located northeast of Hawaii and over parts of central California with most of this due to the recent, ongoing atmospheric river event.

The second image shows rainfall anomalies for this same period a year ago. In contrast to the current situation, average to slightly below average rainfall (yellow areas) had fallen over the central and interior parts of California during this period. Also evident is the well-pronounced, massive area of well above average rainfall associated with last year’s El Nino where well above average sea surface temperatures stretched across the central, equatorial Pacific bringing much enhanced shower activity. That has now been replaced by La Nina conditions, which tend to suppress rainfall in this region as shown by this year’s anomalies.

The current plume of moisture is expected to subside by this Friday with much drier conditions forecast for the weekend.
TRMM was a joint mission between NASA and the Japanese space agency JAXA.
Images produced by Hal Pierce (SSAI/NASA GSFC) and caption by Steve Lang (SSAI/NASA GSFC).
|
|


Google Earth Downloads (Compatible with Google Earth 7.0.2.8415 12/13/2012)
Content Updated:

|
|
|
|
|
|
|
 |
|
 |
Curator:
NASA Official: Dr Scott A. Braun
Friday January 13, 2017
|
|
|
|
|
|
|
|
|
|