|
|

Larger figure |
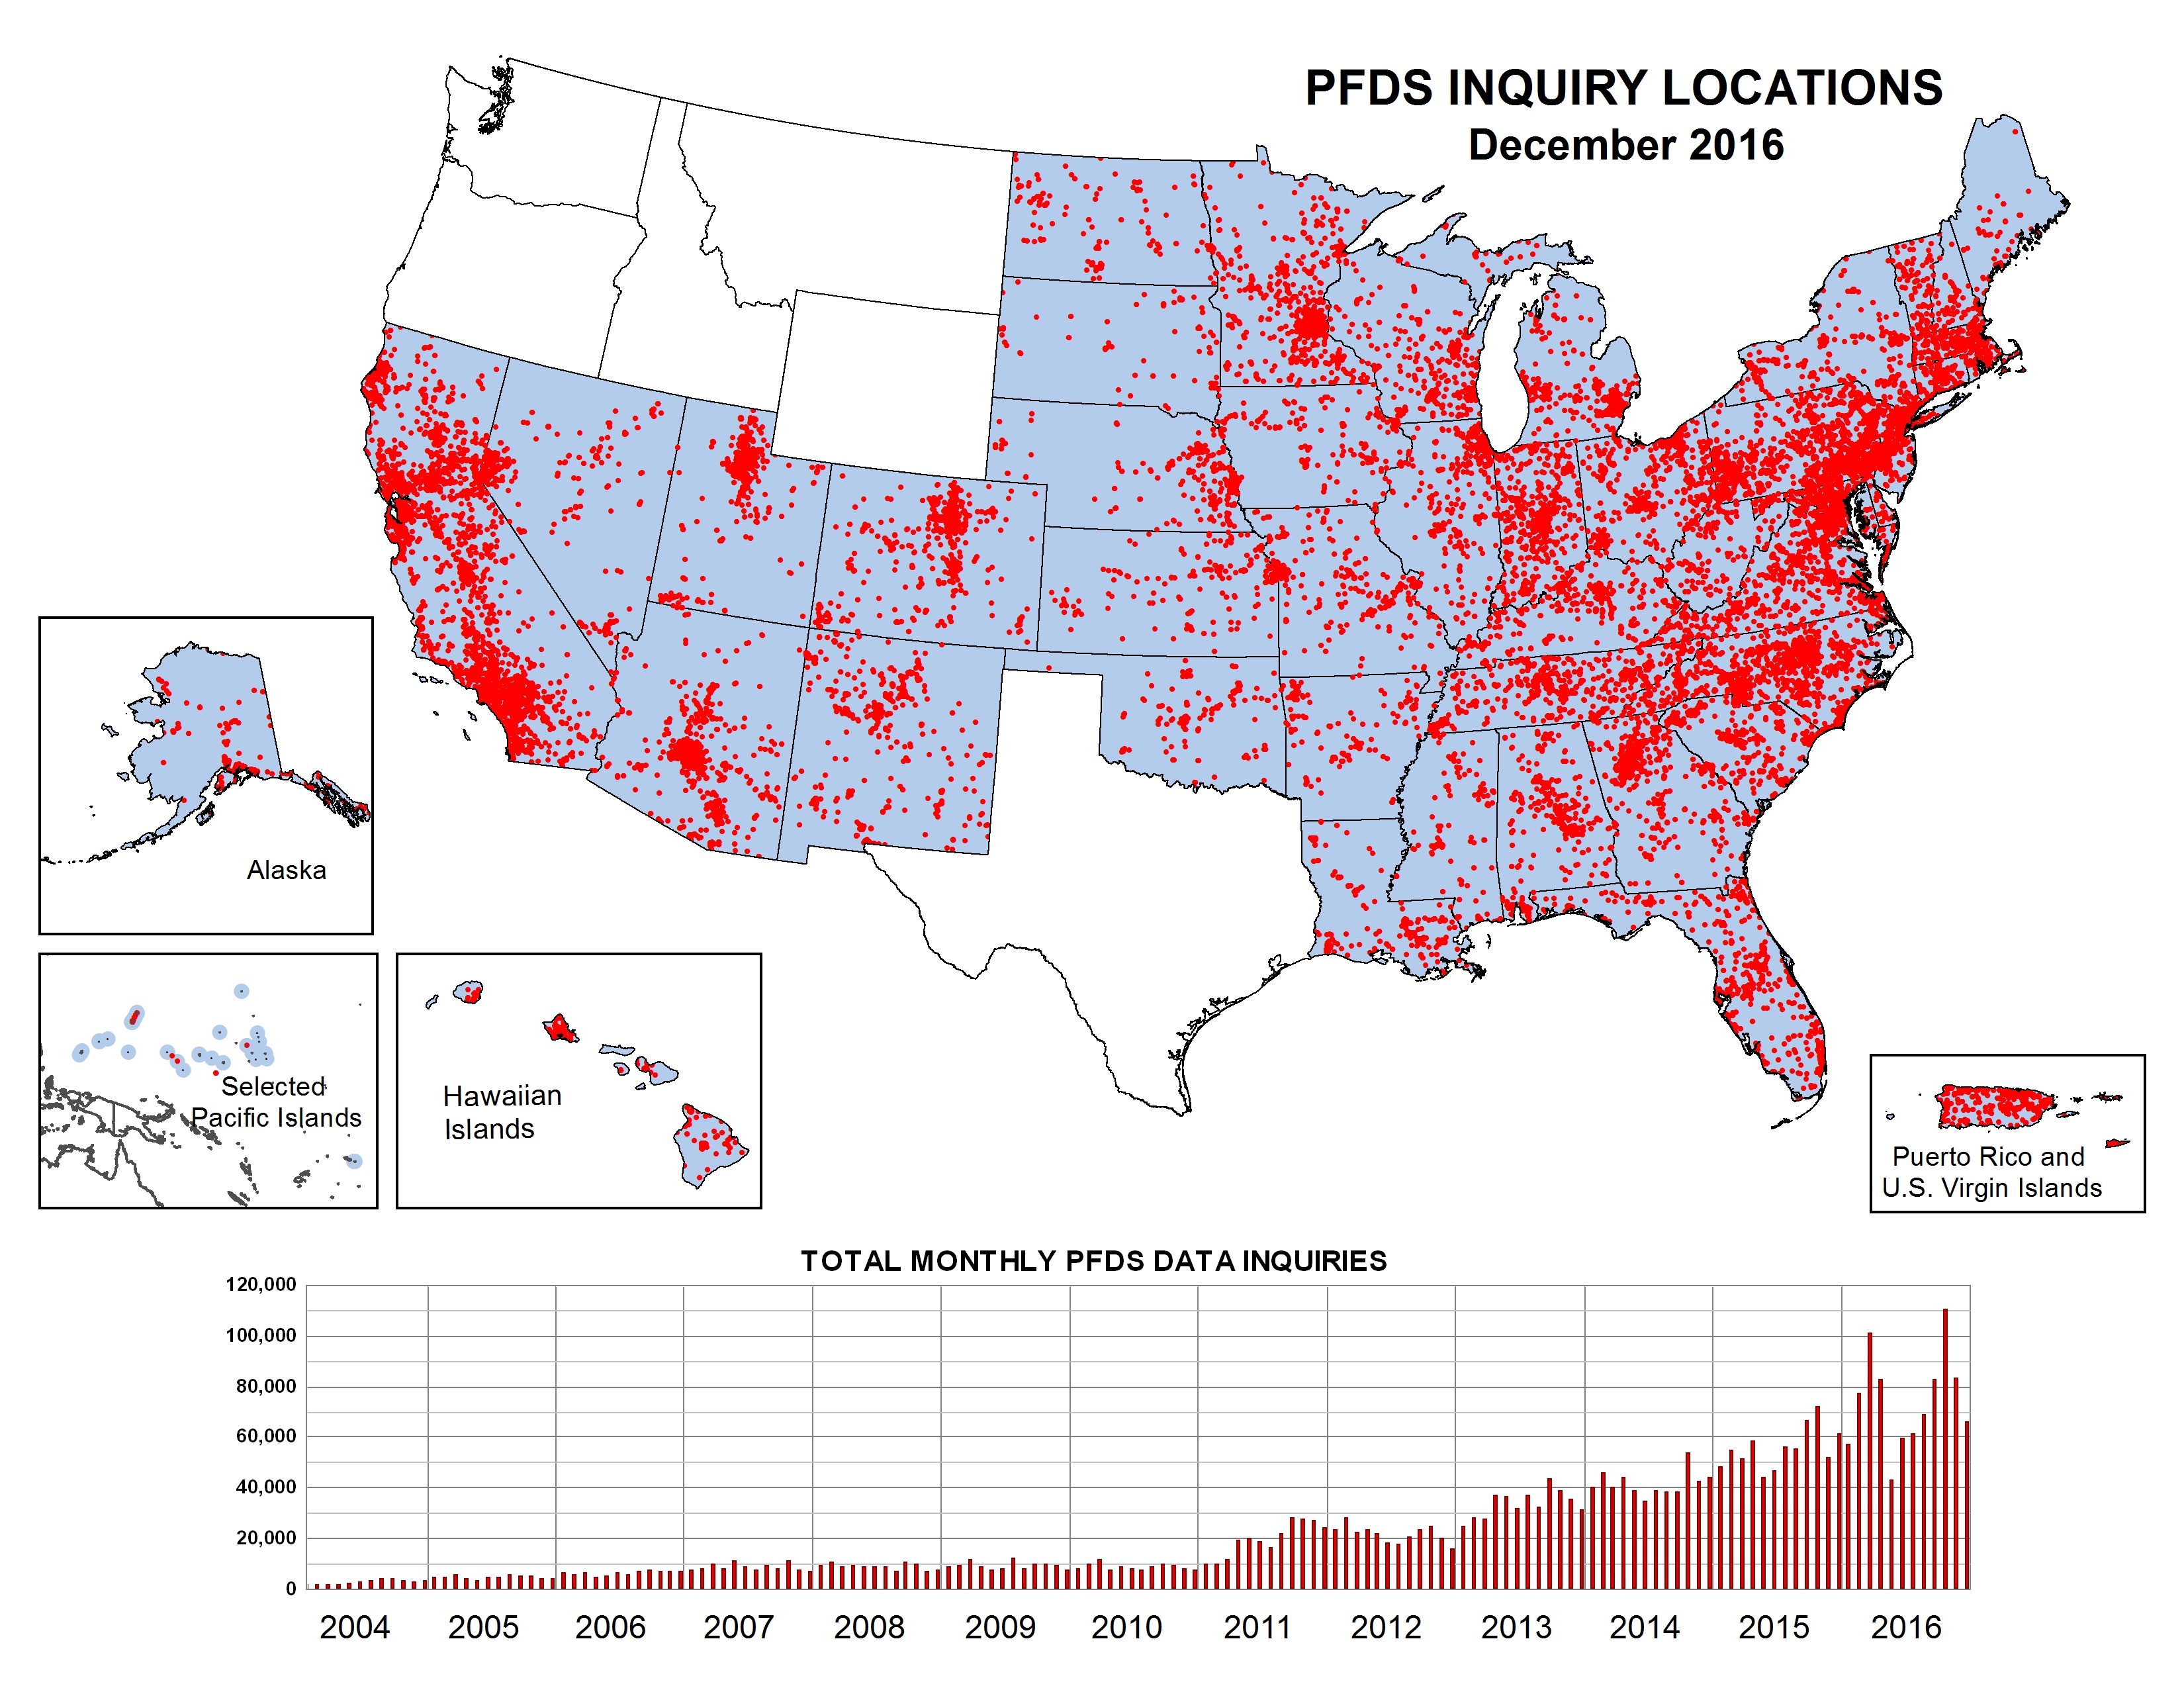
Precipitation Frequency Data Server Performance Statistics
1. PERFORMANCE STATISTICS FOR December 2016
- Total number of Inquiries processed*:
66,107
- Total number of inquiries processed for each series:
Partial duration (default): 63,708 (96.4%)
Annual maximum: 2,399 (3.6%)
- Total number of inquiries processed for each domain category:
.gov: 6,640 (3.8%)
.com: 43,200 (24.5%)
.edu: 6,791 (3.9%)
.mil: 1,185 (0.7%)
.net: 64,271 (36.4%)
.org: 1,088 (0.6%)
.other and/or unresolved: 53,144 (30.1%)
- Total number of inquiries processed for each script:
precipitation frequency table*: 65,902
curves plots: 10,145
pf with confidence intervals plots: 1,372
supplementary info: 6,809
rainfall frequency table: 136
seasonality plots: 403
old webpage*: 205
* Scripts with asterisk were used for total number of inquiries
2. Archived monthly performance statistics
|
|